Posts

Showing posts from July, 2022

Meat and Potatoes

Image
The Meat and Potatoes of the market is where you see where most of the OPENS and CLOSES from the following past trades.  We propose this is both support or resistance areas to enter or exit trades. Meaning, if you are above the Meat and Potatoes, then this would offer support below the market and if below Meat and Potatoes, then this would suggest resistance above the market.  This model is also where the market is likely to come back to. It can also be a C-zone where the market is going sideways.  Think about this idea, if the the market is trending down, and we recognize Meat and Potatoes below and to the left of the chart, we will suggest the market may come back to that range. This can help you decide to place long orders in this range rather than the top of the current bar.  Another scenario - If the market holds above or below Meat and Potatoes -  If the market drop below or above Meat Potatoes and holds, then this would suggest prices are being accepted and price action could co

San Francisco Effect

Image
San Francisco Effect is how the market moves up and down after you get in. This is a uncomfortable pattern, but it happens all the time.  Picture getting in your car and you put it in drive, and you expect the car to go up, and it does.  Then the car stops and starts to row back to where you started. You have hesitation in your eyes.  Then the car starts to go up the hill again past where you were before and are now happy again and cheering! Then the car stops and rows back PAST where you started, you jump out of the car, and what does the car do? It goes up the hill to the top, and you are sitting on the ground. Does this sound like trading to you?  Yes, it does... this is trading.  So, we got comfortable with these moves over time. It still is difficult to watch, we get that.   It is a mindset, and the SF Effect will never stop happening. We know this to be true. It happens many times a day, each and every day in fact.  This is how the Prophet Target model was discovered too.  https:

Never Look Back

Image
Never Look Back -  There are going to be times the trade did not work. It happens... get used to it. It will happen again and again. We built trade models around how to avoid this best as possible. But, it will happen. Markets will get away from you.  Our philosophy is to move on and look for the next trade.  Have the mindset not to hold yourself down if the last trade did not work out.  You got this! Trading is a personality, you can come back!  Look for a new entry model to start your next trade and make sure you apply the correct money management to each trade. In other words, do NOT go all in on any one trade. Scale into trade and out of trades.  When you never look back, you get balanced.  Take a minute, get flat the market, take a walk, come back and say to yourself. What do I see? What model(s) is happening? Then reach for a fill price to scale into trades and apply the scale-out models to lock in potential profits. https://cycletraderpro.com

It Takes Patience

Image
The Futures markets are highly leveraged, and a small percentage move in the market can be a large percentage move in a trading account. There are 2 types of traders: 1. The microwave trader - a trader that is in and out as quickly as possible. This type of trader can do okay trading and have a wonderful life. 2. The patient traders - a trader that can ride out the storms of the ups and downs. This type of trader will have much larger swings in his account and, if correct on the trend, will most likely make a killing if correct, and they stay in for the big moves. Each trader has to decide to trade, act on your trade models, never look back. Try to Go Fish and get reasonable fill prices, scale into trades, and out of trades. Take your ball and go home. Have patience can also work for the microwave type trader -  There will be new position entry points that just do not turn or continue at the speed you might have hoped for. If you are fading a cycle high/low model for example. The marke

Reverse Stab Buy / Sell

Image
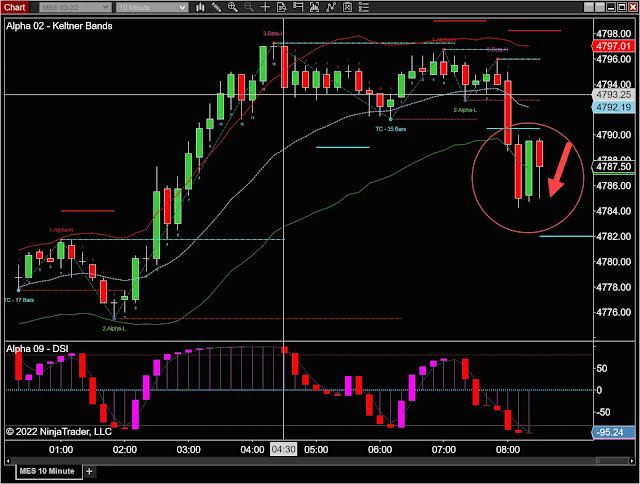
Reverse Stab Buy / Sell - A stab buy / sell is when the prices go past the 1.5 /2.0 deviation of the 15 /20 length moving average.  A reverse Stab Buy/Sell is when the prices come back to the outer bands to go in the direction of the move.  It is that simple! Wait for the market to come back to the bands to enter the market in the same direction.  Keep in mind, that the market can reach the Moving Average too. So, don't go all in on the trade in case you need to scale into the trade too.  https://cycletraderpro.com

RBBS Buy / Sell

Image
RBBS Buy / Sell - A RBBS Buy / Sell (Retracement Bar Buy Sell) is when the previous bar was green and the current bar is red, but has NOT taken out the low of the green up close bar.  These are some of the best entries EVER! And, they are the scariest entries because the bar you are buying is RED. Vice versa for a sell. How to trade this model?  If you want to get in on a long move, wait for the current bar to close up and then wait for the next current bar to show red (below the open) to enter at a better price.  Vice versa for a sell model.  https://cycletraderpro.com

Prophet Target

Image
Prophet Target - Amazing model to understand and watch happen live. This is a new model, it suggests that the market price will retest the last price move. If the market made a low, you may see a bounce, then a retest on the same bar, or the next 1 or 2 bars to the recent low.  Vice Versa for moves up. The market makes a move up to certain price level, then ball bounce down, then a retest of the recent high is what we call Prophet Target. How to trade this model? If the market makes a move, you can do 2 things?  1. Wait for the ball bounce and then enter with a target of the recent move up or down.  2. If already in the move, meaning you may be long the market, then wait for the ball bounce and use the recent price level move as a target exit.  https://cycletraderpro.com

Opposite Close in Dir of Cycle Move

Image
Opposite Close in Direction of the Cycle Move - How many times have you been in a trade and got taken out because the bar close against the move? I bet a lot of times. It happens to us too. So, we needed to learn from this and we did.  Most 4 to 9 bar cycle moves are NOT straight up or down. They have opposite closes along the way. Meaning that if it is cycling up, you will see down closes along the way. Vice versa going down, you will see up close bars along the way.  How to trade this model?  We suggest to be aware of this and see it for what it is worth. Don't jump on the 1st opposite close, wait to see what happens before reacting to them. https://cycletraderpro.com

Ball Bounce

Image
Ball Bounce -  This model is similar to the San Francisco Effect and Prophet Target. The model suggest markets will make a move then bounce the opposite direction for 3 to 8 plus points. Then, move back the price point that it originally achieved. You can't see this clearly on past charts, It is a live action that you will see this model with the current bars normally. But, they this model happens a lot more than people can see on looking on historical charts.  How to trade this model? There are 2 ways to trade this model - 1. Wait for the move to happen, then fall back, then reach for an entry in the same direction to enter or exit the market at the current extended price levels.  2. Don't jump out of a trade if your exit order is not filled right away, wait for the bounce back. We call this Prophet Target model too.  https://cycletraderpro.com

100 Percent Bars

Image
100 Percent Bars - The model is when the current bar exceeds more than the length of the previous bar by 100% or more.  Afterwards, the market tends to come back to the mid point of the bar that caused the 100% bar.  How to trade this model?  When you see a 100% bar, it does not mean you need to jump in at the point, you can wait for the market to come back to the 50% level to enter if you like the direction of the move.  https://cycletraderpro.com

The Band's Angle - 45 Degrees

Image
The Band's Angle - 45 Degrees - When the angle of the bands is at 45 plus percentage, the trend tends to be in that direction. It is an excellent filter when wondering what the trend is for the moment.  How to trade this model? If the model is long, look for entry models in the same direction.  When the market is about to turn, the bands will go flat many times and start to give you an indication of a turn in price direction.  https://cycletraderpro.com

Above / Below Moving Average

Image
  Above / Below Moving Average - Markets tend to be long above the moving average(s) and short below them. We use a 15 length moving average most of the time.  How to trade this model? When the market is above the MA, consider looking for dips to enter the market above the MA. Vice versa below the MA.  https://cycletraderpro.com

Walter Bressert's Best Trade Setup

Image
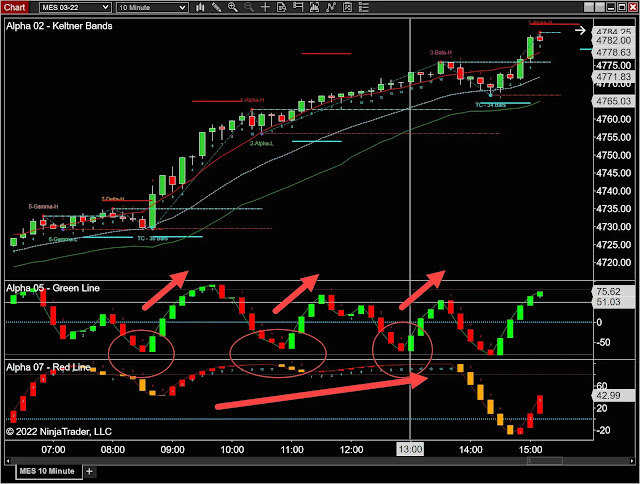
 Walter Bressert's Best Trade Setup -  When my father developed the Green Line (Double Stoch) and the Red Line (B-Line Bressert Line), he really had something. He did this in the early 90's. These 2 indicators tell a story you will never see with any other 2 sets of indicators.  What is the set up? The set up is simple. If the Red line is in the sell zone, and the Green Line is in the buy zone, that is a buy. Vice versa for a sell short entry model.  That's it.  The Red Line is momentum based and the Green Line comes down into zones to show the "When" to look to enter. We look for this all day to occur and they occur often enough to wait for them. We always say if there is just ONE model to follow, this could be the one.  https://cycletraderpro.com Video

Stab Buy / Sell model

Image
Stab Buy / Sell model - This model is when price levels exceeds a 1.5 or more deviation from the 15 / 20 Moving Average - What happens when the price level extends?  The market price typically moves back to at least the upper or lower Keltner bands.  For example, if the 1.5 deviation is at 4150 and the market drops to 4142, this would set up a Stab Buy. In this case, one would expect the market to at least move back to the 4150 range.  Note: The bands will move on each new bar. Keep this in mind if the market price holds up or down. On the next bar, the formula of coming back to the band's still works, it's just the bands are also moving with the market on each new bar.   The more significant the deviation move, the higher likelihood the trade will work out. There is no 100% trade, but this one is up there. Note: This type of trade is also considered the riskiest trade model on our list, which means that sometimes, the market may not come back to the bands for a while and hold

FAIL Trading Model Against the Moving Average

Image
A FAIL is when the market moves above or below the 15 moving average and FAILS back the other way - A FAIL usually takes place within 1 to 3 bars.  The reason for the FAIL model was to identify the pattern the market was in at the time and understand that market can go past the moving averages and FAIL back to the original trend. Meaning, just because the market may have dropped below the moving average, it may not mean the upper trend has stopped.   Note: All Trading Cycle (TC) Lows do happen below the 15 length moving averages and a drop below the moving average is expected. When the TC Low is confirmed, one would expect a 4 to 9 bar cycle period up from the TC Low.   https://cycletraderpro.com

Divergent High/Low

Image
The Divergent High / Low model is a fade pattern. The Divergent High/Low is when the market makes a new high or low, and the Alpha Green Line indicator did not make a higher high or lower low. How to trade this model? When the market makes a move like this, consider fading the move.  https://cycletraderpro.com

C-zone (Congestion Zone)

Image
The C-zone (Congestion Zone) view are when prices are trading sideways with no advanced breakout moves. When do C-zones typically occur?  Markets make small or large trend moves, then they congest for 4 to 9 plus bars. Meaning, most of the time it is after the market makes some kind of move.  How to trade a C-zone?  Once in a C-zone,  Go Fish for buy new the low of the range and sells near the high of the range.  The profit target is the opposite side of the range. https://cycletraderpro.com

Consecutive Closes Trade Model

Image
Consecutive Closes - The Consecutive Closes model suggests that the market will go 3 to 4+ consecutive close in a row before there is an an opposite close, or reversal in the trend.   The model does not mean the current trend is over; it suggest a setback is anticipated.  Current Bar -  The current bar is counted into the Consecutive Closes model.  Meaning, if there were 3 green bars up with up closes. and the current bar is also above it's opener, this would count as bar 4.  But, if the current bar closes below it's opening, then the past view would have been 3 consecutive closes up, then the reversal bar.  How to trade Consecutive Closes?  This model is also known as Ops Up / Ops Down, but once you get to 3 to 4 plus bars, you can expect some type of set back. Keep in mind this does not mean the move is over, just a set back. https://cycletraderpro.com  

4 to 9 Bar Cycle Count

Image
4 to 9 Bar Cycle Count -  Most markets follow the 4 to 9 Bar Cycle Count from low to high and high to low. The cycle count is accurate for all markets and all time frames.  Meaning, it does not matter if you are trading pork bellies, currencies, indexes, or bonds; the cycle count is valid in all markets and all time frames, 1,4,6,10, 15, 40, 60, 120, etc minute charts. The Alpha CycleWave indicator plots these cycle counts in real-time.  The setup is to wait for the market to reach a cycle bottom or top and exit positions. This gives you the "timing" to look for when markets are likely to turn.  There are what we call "extended cycles". This is when the market will go past the 9 bar cycle count. You can look for these extended cycle counts in trending markets.  We suggest to look at all time frames. Meaning, if the 60 minute chart is only 3 bars up, and the 5 minute chart is making a 7 to 9 bar cycle high, it may be best to wait for the 5 minute bottom to go long ra

Trading Cycle Low

Image
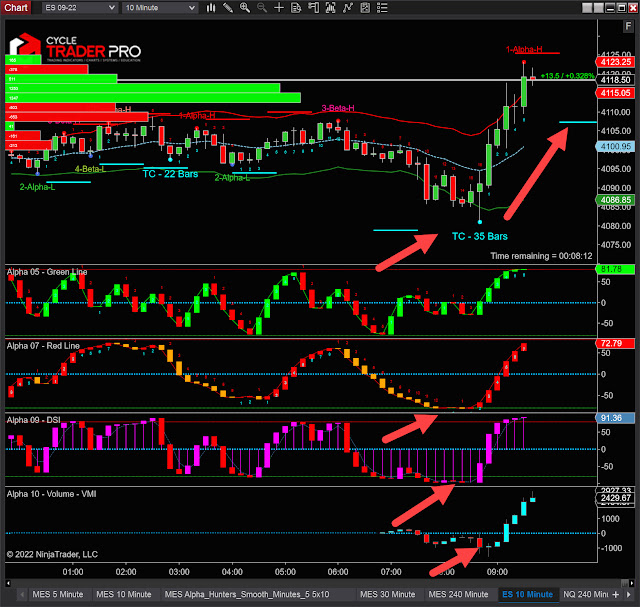
The Trading Cycle (TC) Low measures the number of bars from low to low.  It only measures low to low.  Cycle Trader's TC LOW to LOW count is frequently from 16 to 28 bars. Meaning once there is a TC Low, we would start to look for another TC Low starting after 16 bars from the current TC Low.  The TC Low is not measured before 16 bars but it is measured past the 28 bar(s). All TC lows occur below the 15 period moving average on all chart time frames. Meaning, that if the market is above the 15 period moving average and it's been 25 plus bars from the last TC low, then it is expected that the market to drop below the 15 period moving average to create the TC Low.  Trade opportunity - If the market is overdue for a TC low and the market is trading above the 15 Moving Average, then expect the market to start back to the Moving Average soon to make that TC LOW.   Trading Cycle Plot Automatically - The Alpha CycleWave Indicator plots all the cycle counts and highlight the TC lows